Slightly random question here but I think it might appeal to the statistically minded here.
I have a couple of friends who play pro golf on different tours and mini tours who rely on different stat tracking apps. Many of them put a lot of weight behind the results of these stats on a week to week basis to inform their practice and focus over the following days.
Given most events are 3-4 rounds over a couple of days and there is a lot of variation in types of shots hit, lie, wind etc. What is the minimum number of shots you would require for a given distance over a short period of time to get a distribution or pattern that would be statistically significant? I assume the distribution and variance of the pattern would have a large effect on the number of shots required but using a tour player as an example the shot pattern should be relatively tight.
Yeah this is an interesting question… my guess is they are mostly reacting to noise if only looking at a few weeks worth of data, but when you are the one actually hitting the shots you obviously have more insight into what might be noise versus an actual change in performance. There is also the additional wrinkle of these guys not having data for the rest of the field, and therefore not knowing whether the course was playing hard on approach shots for everyone, for example.
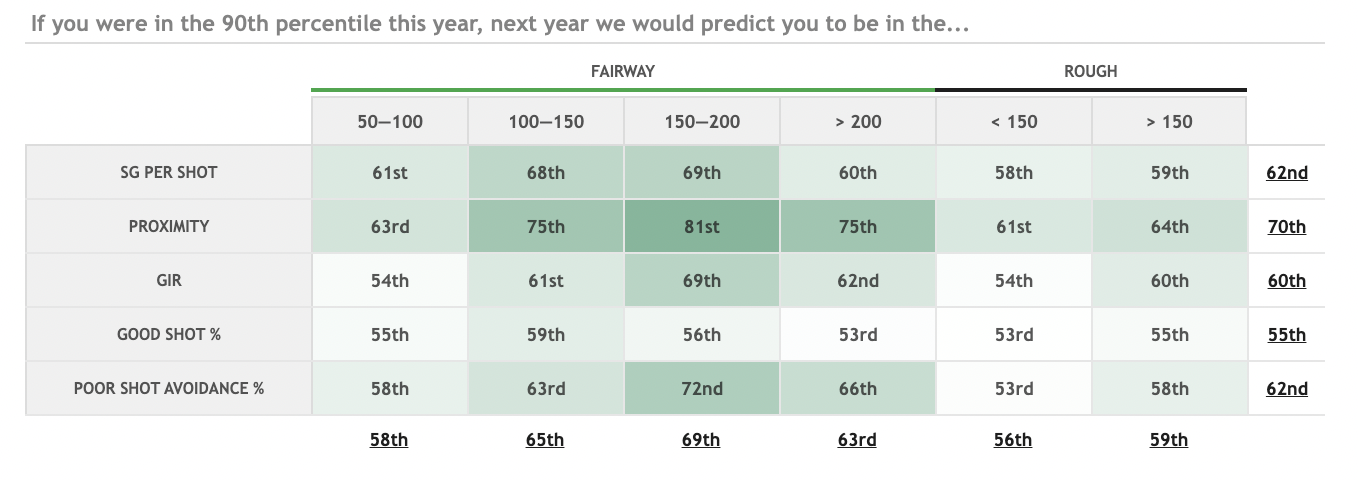
In a blog post from a couple years ago we made this table:
which basically shows how much noise there is in a years worth of data (or it could be showing how much a player’s ability changes from year-to-year… but my guess is that this is mostly driven by noise). And a year’s worth of data in each of these bins will be 100s of shots.
As a very rough estimate… on approach shots the standard deviation in adjusted SG is around 0.35 strokes (obviously depends on a lot of things if we zoom in on a specific shot type), so that means the standard deviation of the average SG for N shots will be 0.35/sqrt(N).
Hi Matt, that’s great thanks for the detailed answer.
As far as I know the stats are all benchmarked against tour averages which I assume would overestimate skill level since setups would be easier than tour venues. As you say though being the one hitting the shots would obviously give you an intuitive sense of performance relative to your own abilities.
Interesting that proximity and poor shot avoidance seem to be the better indicators of future SG performance than historical SG performance. I remember reading somewhere about one of Tiger’s best years where he would hit iron shots that lost SG less than -.5 or -.75 incredibly rarely.
When you don’t have the data for the rest of the field do you think it would make more sense to track absolute stats like proximity, distance from edge of fairway etc. rather than SG versus tour average?
You could use SG as a top line KPI to see how the overall driving, approach, around green game is progressing. I agree the sample sizes needed are larger than a couple weeks, especially since these shots aren’t being contextualized for difficulty outside of yardage and fairway / rough. You are almost certainly focusing on noise. And there are downsides to SG - it introduces a lot of extra calculation and obscures the detail of the data a golfer has on himself.
From a golfer’s perspective you would likely want to focus on the underlying metrics - distance, proximity, driving accuracy, etc. And given the wealth of data they have on themselves they could track it by club choice in addition to yardage. Maybe even keeping notes on rating how aggressive they played it scale of 1-10 to get a sense of where the best risk-reward is. For driving distance, which appears to be the most important correlation to success on tour, I would note distances vary a lot from course to course. They might be best served calculating distance vs. course average or just seeing how they rank compared to their competition that week if that data is available. You want to be towards the top, fun question to think about.
For the statistical question I would look into the power t test - using R or Python you can calculate the minimum number of samples needed given some information about your distributions.
Ya as Matt pointed out the real issue is not having the field data to compare yourself to. The idea of keeping a number of KPI’s such as proximity or distance while relevant would probably vary a lot week to week given different courses and setups so may not provide much value to the player.
I heard Scott Fawcett talk recently about using the Tiger 5 in order to circumvent this issue of not having the data of competitors. That system provides a decent set of KPI’s that might be more beneficial to compare over a period of time.
One thing I see promoted by many course management techniques like DECADE is the concept of the shot dispersion in order to pick targets and minimise penalty shots. I find that a useful rule of thumb for thinking about lines/club selection but I assume it has issues again surrounding the statistical significance of the distribution pattern. Also I suspect distribution patterns for golfers would not be normally distributed which would not help.